ObserVIEW Vibration Test Development Software
View, edit, and analyze waveforms from recorded or live data. This powerful and efficient vibration analysis software includes specialized modules for waveform recording and test profile development.
ANALYZE RECORDED DATA AND DEVELOP VIBRATION
ObserVIEW

DATA EDITING
View data files for free! Crop, copy, cut, and paste sections of a waveform or append multiple compatible files. ObserVIEW can import .txt, .csv, .uff, .wav, .vfw, and .mat files
WAVEFORM ANALYSIS
User-friendly vibration analysis options for both proficient engineers and those new to the industry, including FFT, resampling, filtering, PSD, transfer function, and more

MODAL TESTING
Intuitive project setup dialog that walks you through parameter selection. The automatic location sequencer tells you exactly when and where to strike the DUT.

TEST PROFILE DEVELOPMENT
Test development options for replicating a component's operational environment using field data, including accelerated random, sine-on-random, and complex shock.
DO MORE WITH YOUR DATA
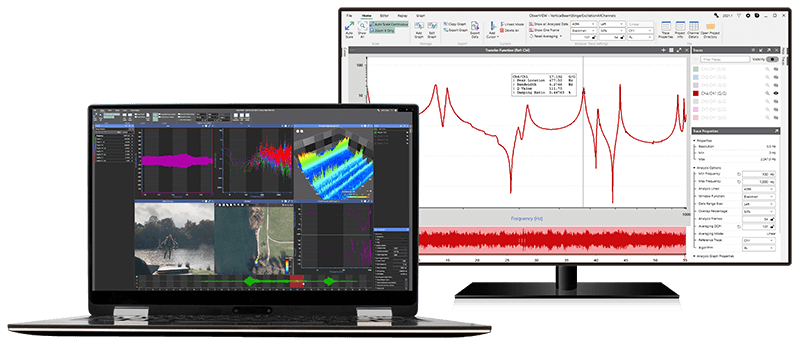
Data Analysis
Manipulate test data with one or more of ObserVIEW’s many analysis options. Data analysis helps uncover pertinent information, compare results, and calculate values better than raw data alone.
ObserVIEW can analyze data supports most text and CSV files from any data acquisition system. It handles large recording files (100+ GB) with ease and can synchronize data from multiple DAQ devices. ObserVIEW is equipped to process multi-channel analysis for high-channel systems, while its user-interface is accessible to engineers at every level.

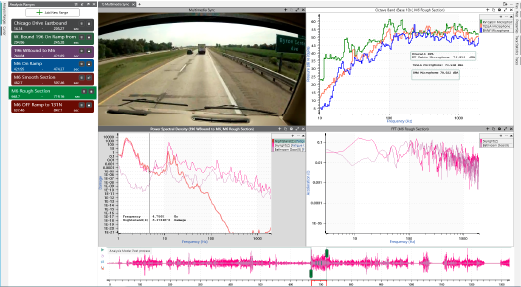
Monitor a live data streamObserve real-time vibration levels to monitor system integrity, detect anomalies, or confirm test conditions.
Sync media files with data recordingsCorrelate visual events with vibration spikes or failures for root cause analysis.

Edit, append, and export filesClean or combine datasets, add metadata, and export to formats compatible with analysis or reporting tools.
Apply frequency-domain graphs for power or statistical analysisIdentify dominant frequencies, assess spectral content, and evaluate energy distribution to validate results or diagnose issues.
Resample and filter dataRemove noise or aliasing, focus on relevant frequency bands, and prepare signals for analysis.

Extract orders to analyze rotational or reciprocating componentsIsolate and track vibration harmonics tied to RPM to assess performance or detect imbalances.
Fatigue Damage
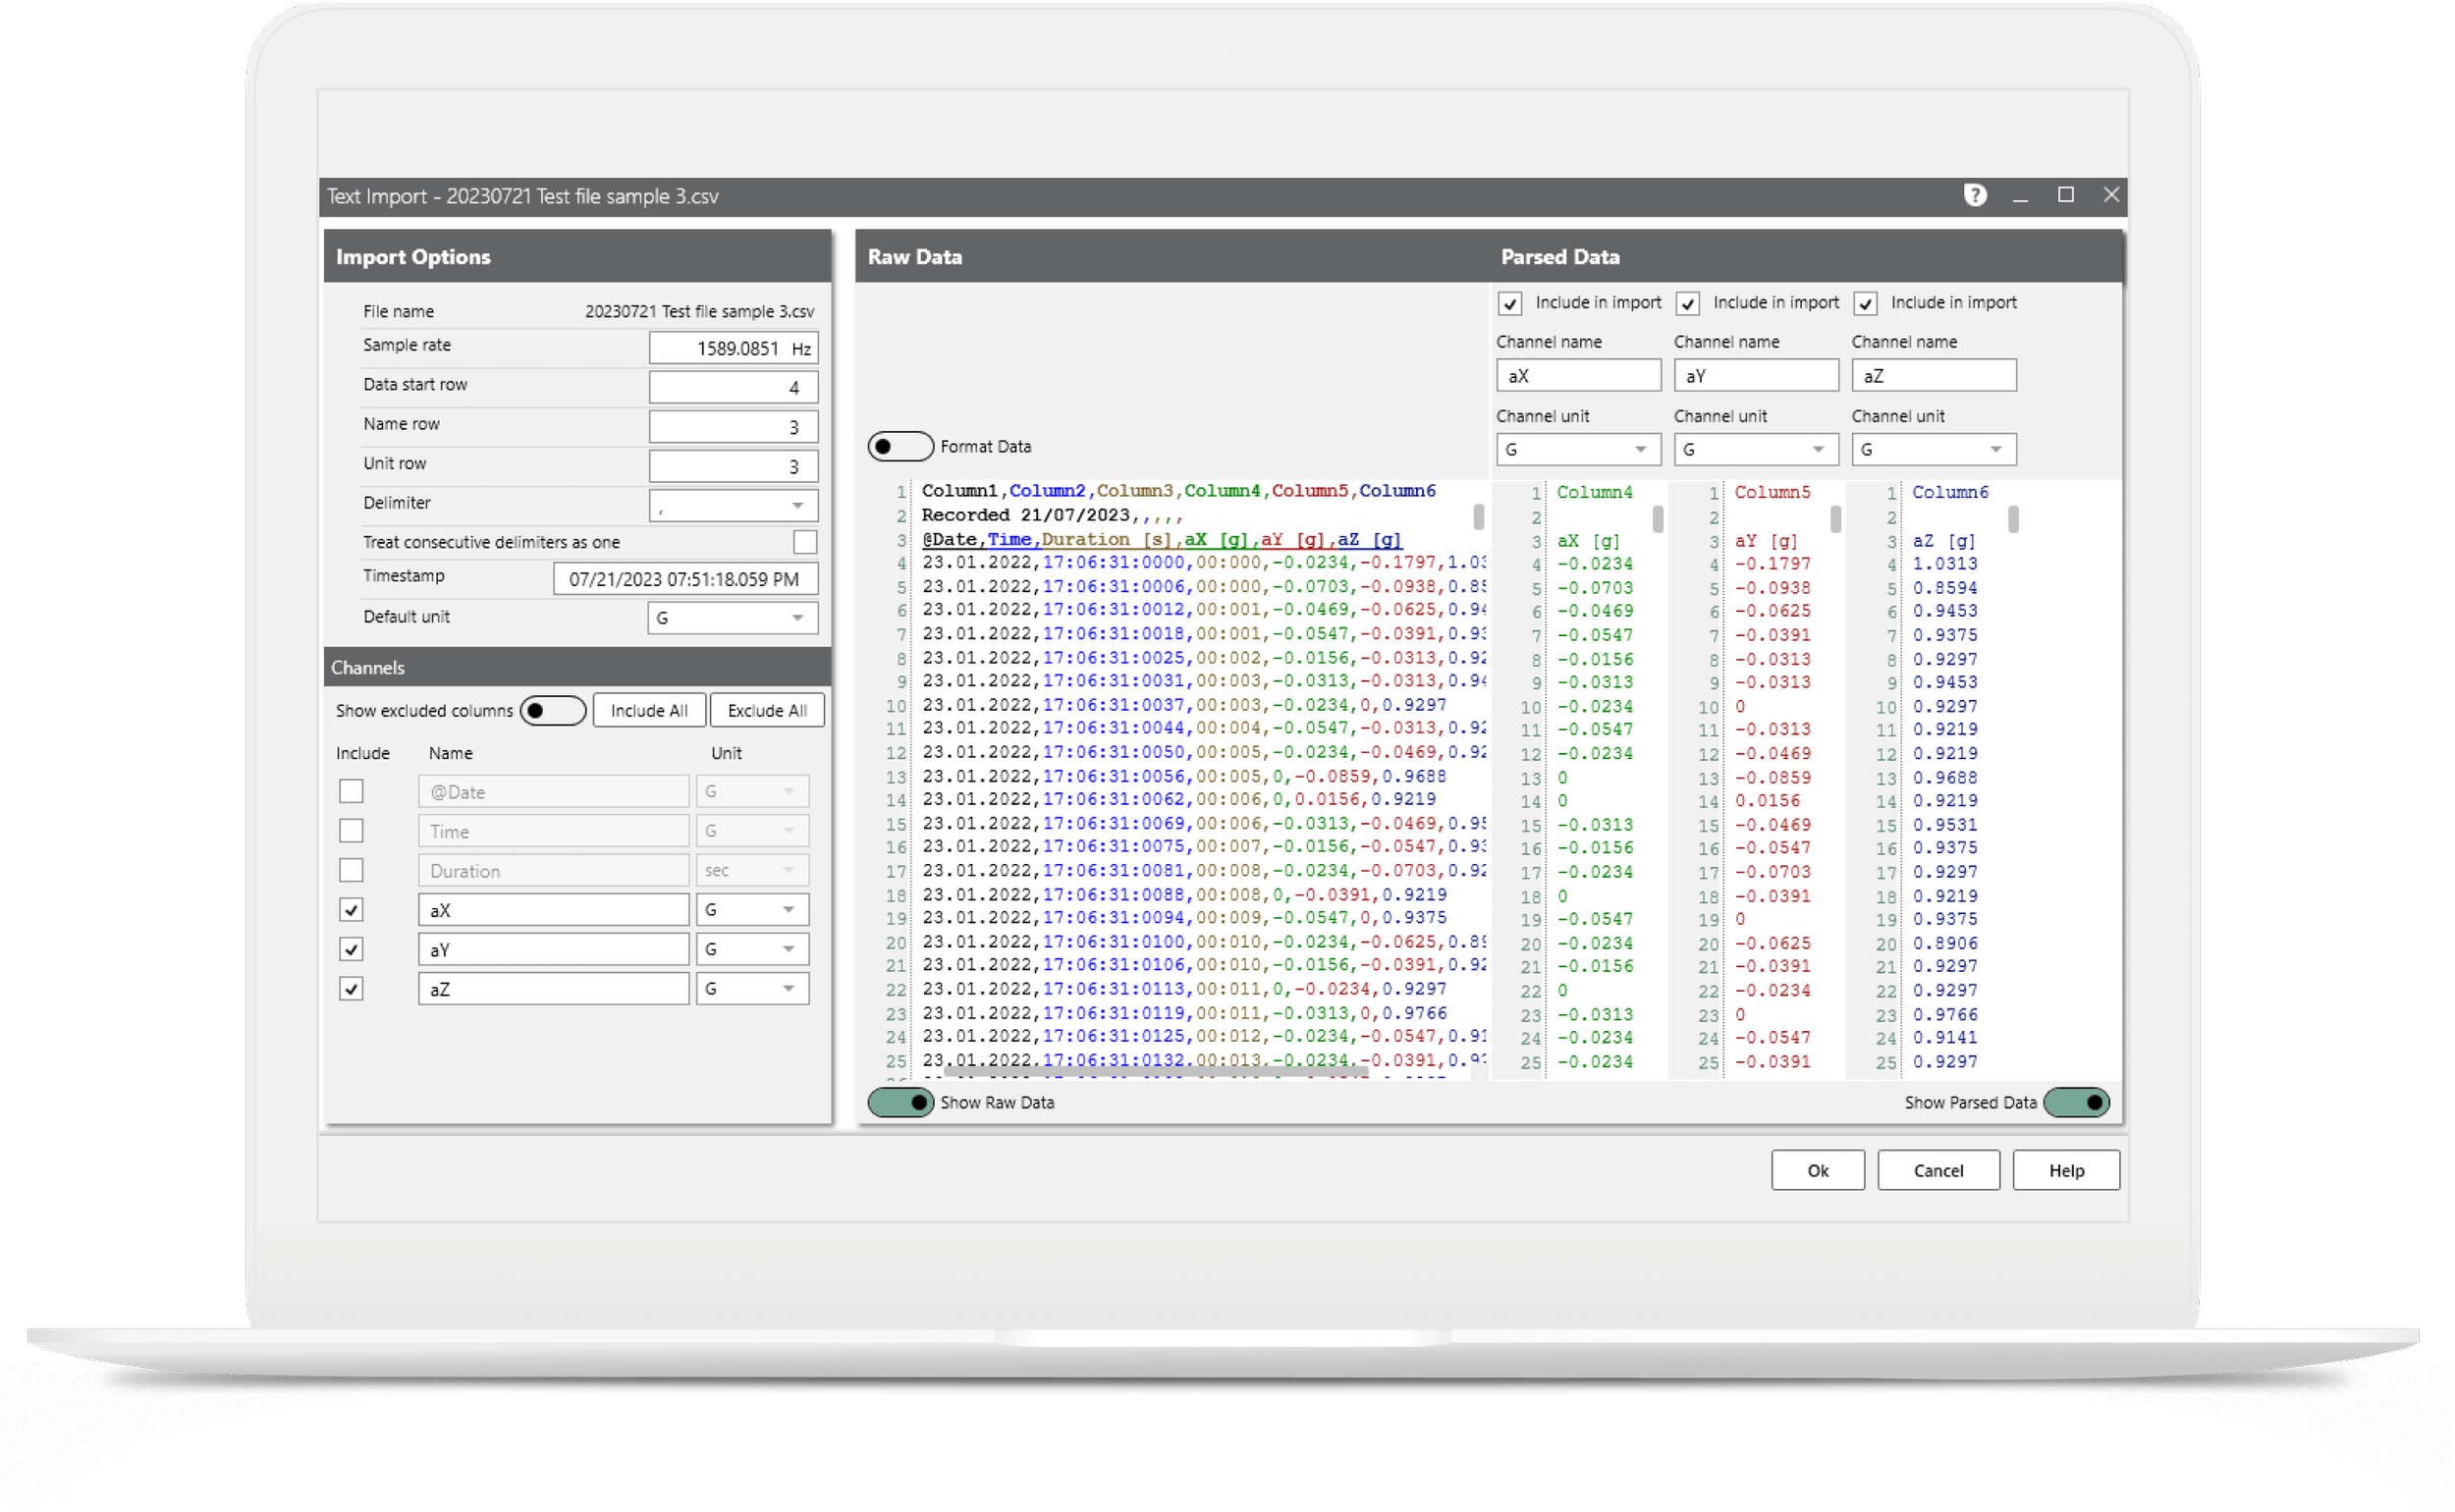
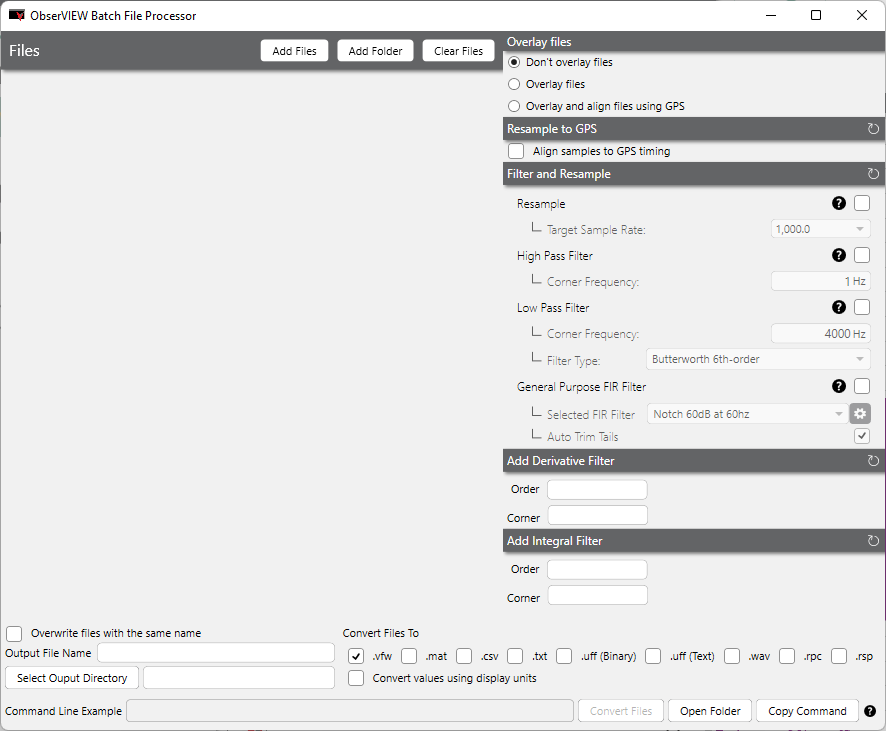
Import 100+ GB of data from any data recording device to analyze in ObserVIEW. For large/multiple files, use the Text Import dialog to define import options or the Batch File Processor to overlay, filter, and resample files. ObserVIEW supports the following file types:
• CSV
• Text
• MTS RPC
• Universal File Format
• VFW
• WAV

WITH FIELD-RECORDED DATA
Test Development
Develop custom test profiles reflective of your component’s end-use environment with ObserVIEW’s test development software options. Test standards can omit potentially damaging peaks or over-test the component, leading to over-design. Engineers can improve their test profiles with field-recorded data.
Monitor a live data streamObserve real-time vibration levels to monitor system integrity, detect anomalies, or confirm test conditions.

SHOCK RESPONSE SPECTRUM (SRS)
The SRS creates a complex shock test profile from one or multiple recorded shock events.

FATIGUE DAMAGE SPECTRUM (FDS)
STAG allows engineers to analyze, generate, and accelerate a realistic sine-on-random vibration test. It uses order analysis and the fatigue damage spectrum to ensure all of a test profile’s vibration components are an accurate representation of the operational environment.
SINE TRACKING, ANALYSIS AND GENERATION (STAG)
Need Help? Let’s Talk!
Have questions or need support? Our team is here to assist you. Reach out now!